


Here’s the thing: how often do you consult the footer of a website you’re visiting? I go to the footer when I can’t find something elsewhere, either in the header, the top navigation or on the page. Looking at the footer of a website is a last resort, not a primary activity for me. I’m not alone.
When we discussed it, they agreed to do a test. For reasons beyond our control, we weren’t able to do a true A/B split test. But we were given the okay to move the email opt-in CTA to the top of the website, below the navigation in the header, and see how this would impact email list growth. Wireframes illustrating the ‘before’ and ‘after’ views appear below.
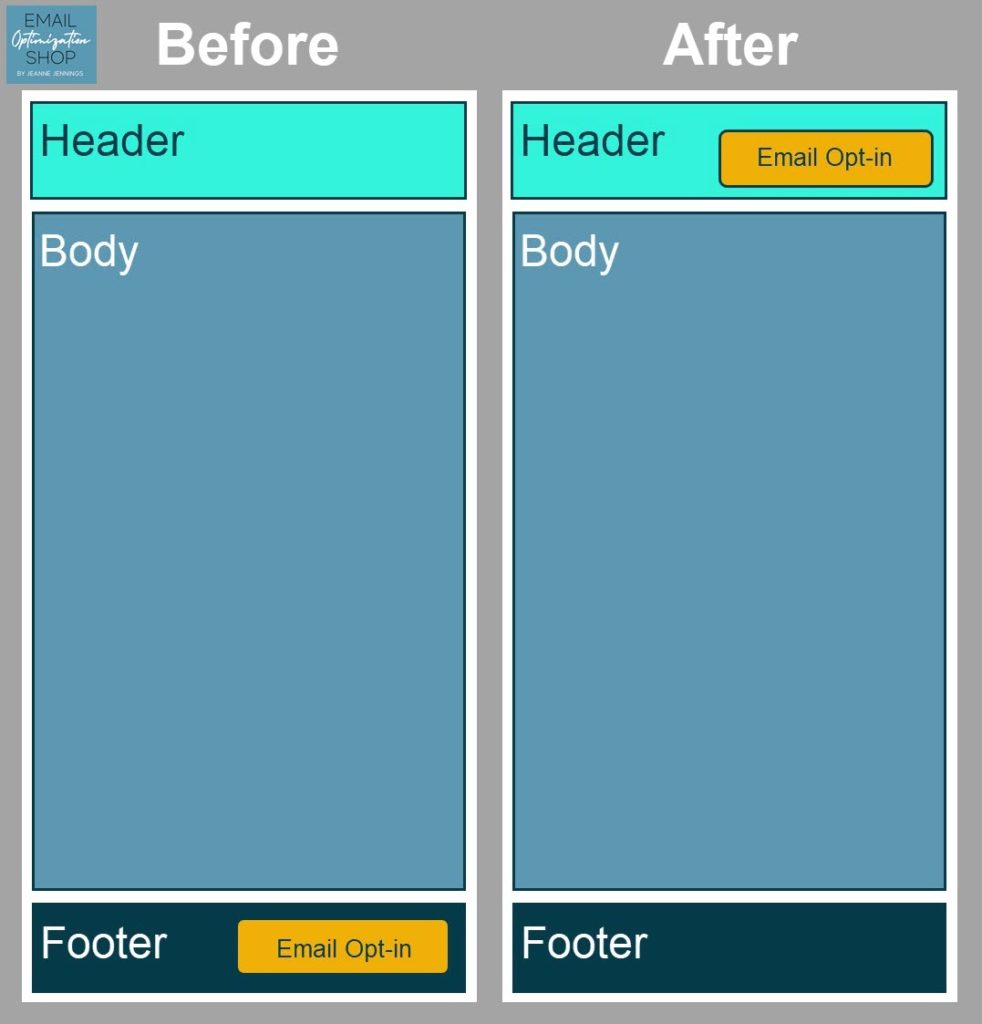
The only change we made to the opt-in call-to-action was the location on the page; we didn’t change the copy, the, or any other element. It wasn’t a particularly fancy or effective creative (we would go on to optimize copy and design later); it appears below.

The metric I use to gauge the effectiveness of an email CTA is a specialty conversion rate (CR). It’s a conversion rate because we are calculating the percentage of people who convert; our definition of a conversion here is an opt-in sign-up for the email program.
The numerator (top of the equation) is the number of new email subscribers from the CTA and the denominator (bottom of the equation) is the number of new, not returning, website visitors. Like this:

Why new, not returning, website visitors? Because if you have content on your site that you update on a regular basis, like a blog, you’re purposely pulling people back to your site to read it. Many of those people may already be subscribed to your email program. By looking at just new, not returning, visitors, we weed out these people who are likely already subscribers.
Another reason? It makes the denominator smaller and allows us a clearer read of what’s going on. If we used all website visitors, the denominator would be much larger, and you would only be able to identify large changes in the ratio of new subscribers. By weeding out that ‘static’ we get a more precise number which allows us to see and react to smaller changes in the figure.
Let me illustrate how to use this formula.
Number of New Email Subscribers from the Website Email Opt-in CTA: 1,365
Number of New (not Returning) Website Visitors: 39,247

So, what’s a good percentage of new email subscribers divided by new website visitors?
There’s no one-size-fits-all number. When I developed a very focused landing page to drive leads for a client, we got a conversion rate greater than 80%. But that’s unusual.
Most companies should be able to get between 5% and 20% of your new website visitors to opt-in to your email program. Even getting to 5% usually takes a little optimization – most of the clients I work with start off with a conversion rate of less than 1.0%.
So, did we see a change in list growth when we moved the email opt-in CTA from the footer to the header of the website?
We did!
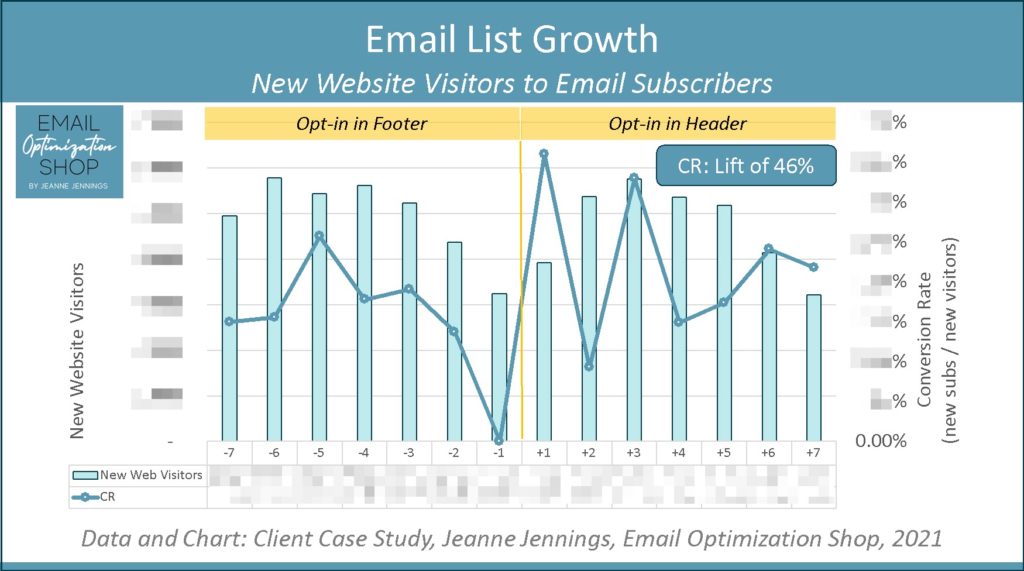
Moving the email opt-in CTA to the header resulted in an immediate 46% increase, on average, in the conversion rate. That means that 46% more people opted in for email each day when we changed the location of the email opt-in CTA.
How to read the chart above:
- the bars represent the number of new, not returning, website visitors each day
- The line represents the percentage of new email subscribers from the website, using the formula above
- days -1 to -7 are the 7 days right before we moved the email opt-in CTA from the footer to the header.
- days +1 to +7 are the 7 days just after we moved the email opt-in CTA to the header
This is just one client; you may see different results, higher or lower. But I’ve never seen a decrease in the percentage of opt-ins when the email CTA is moved from the footer to above the fold.
Using the illustration above:
Number of New Email Subscribers from the Website Email Opt-in CTA: 1,365 1,993 (46% increase)
Number of New (not Returning) Website Visitors: 39,247

What would a 46% increase in list growth do for your email marketing program? If you are adding 1,000 new subscribers to your email list each month, you’d suddenly be adding 1,460. 10,000 new subscribers would turn into 14,600. You would increase your list growth by almost 50%, with just this one small change to your website.
So, if your email opt-in CTA is in the footer of your website, consider this your rallying cry to move it above the fold, preferably into the header. Give it a try and let me know how it goes!